
Overview, traffic and logs
Bindings
Section titled “Bindings”The Overview tab draws the Worker and everything bound to it: D1, KV, R2, Durable Objects, service bindings, queues and variables. Switch between Diagram and List. Each binding’s ⋯ menu copies its name, id or details.
Newer bindings are shown with what works locally, taken from wrangler’s own local-support table:
| Binding | Locally |
|---|---|
Email (send_email) |
Captured, not delivered |
| Vectorize | No simulator. Needs remote: true for a real index |
| Workers AI | Always runs on your account, and may incur charges |
| Hyperdrive | Needs a localConnectionString |
| Analytics Engine | writeDataPoint() does nothing |
Traffic
Section titled “Traffic”While the server runs, Traffic shows requests, the 5xx rate, p50 and p95 latency, a 5-minute chart and the busiest routes. It’s parsed straight from the dev server’s log lines, so there’s nothing to install in your Worker.
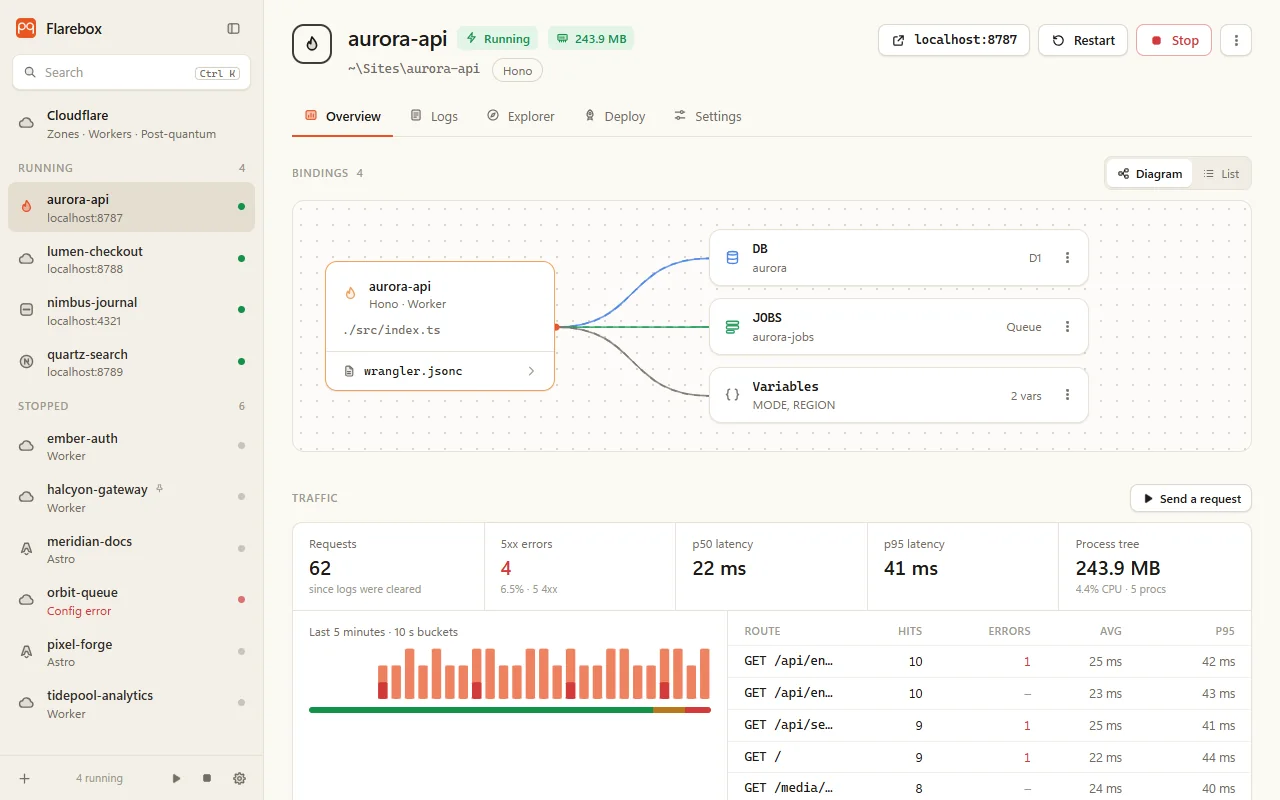
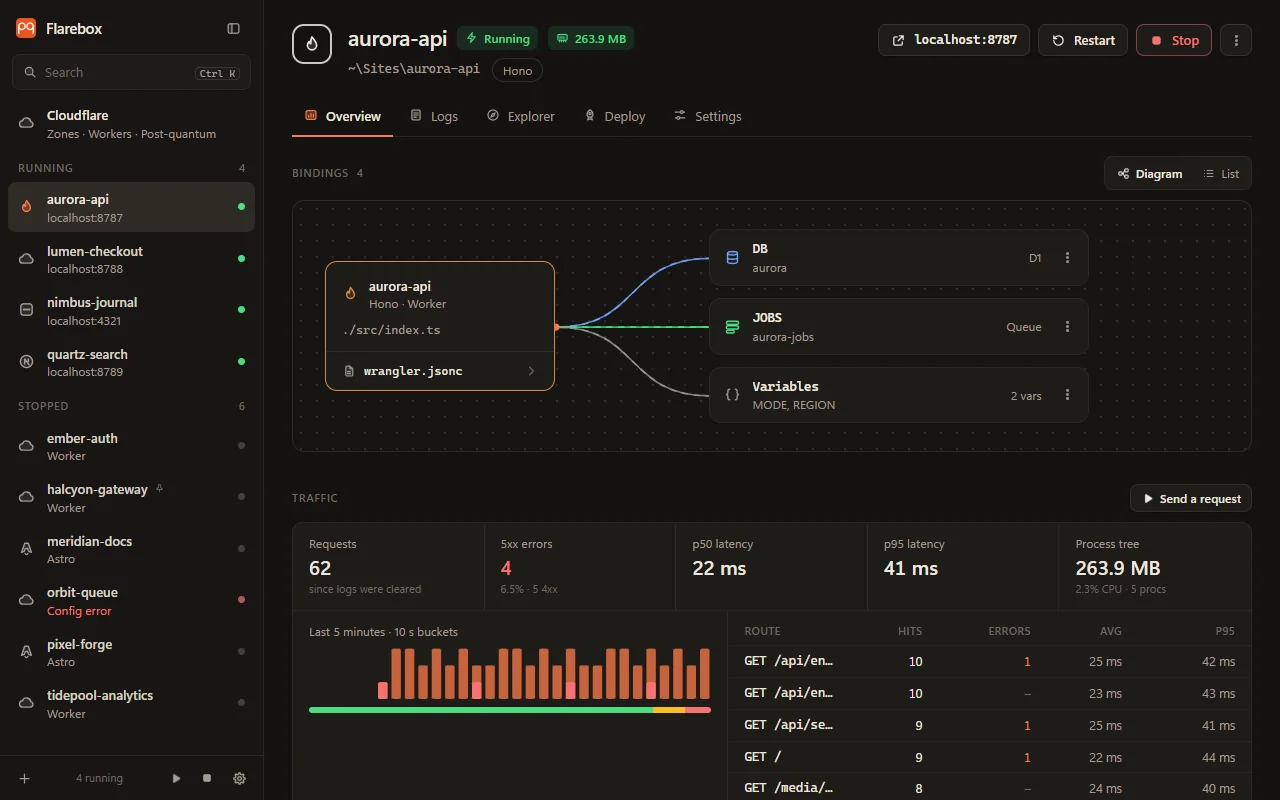
Send a request sends one to the dev server from Flarebox, and any request in the list can be replayed.
The header shows the process tree’s memory and CPU, summed over node and workerd.
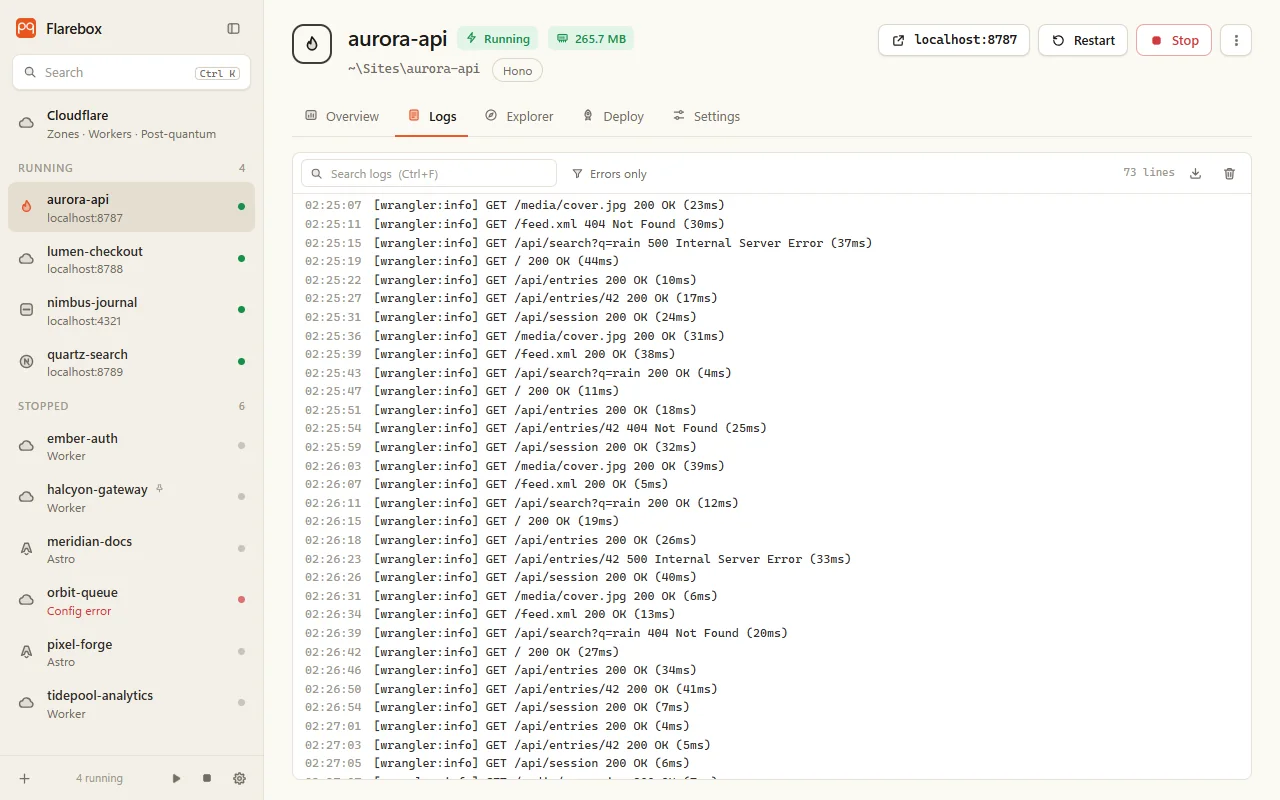
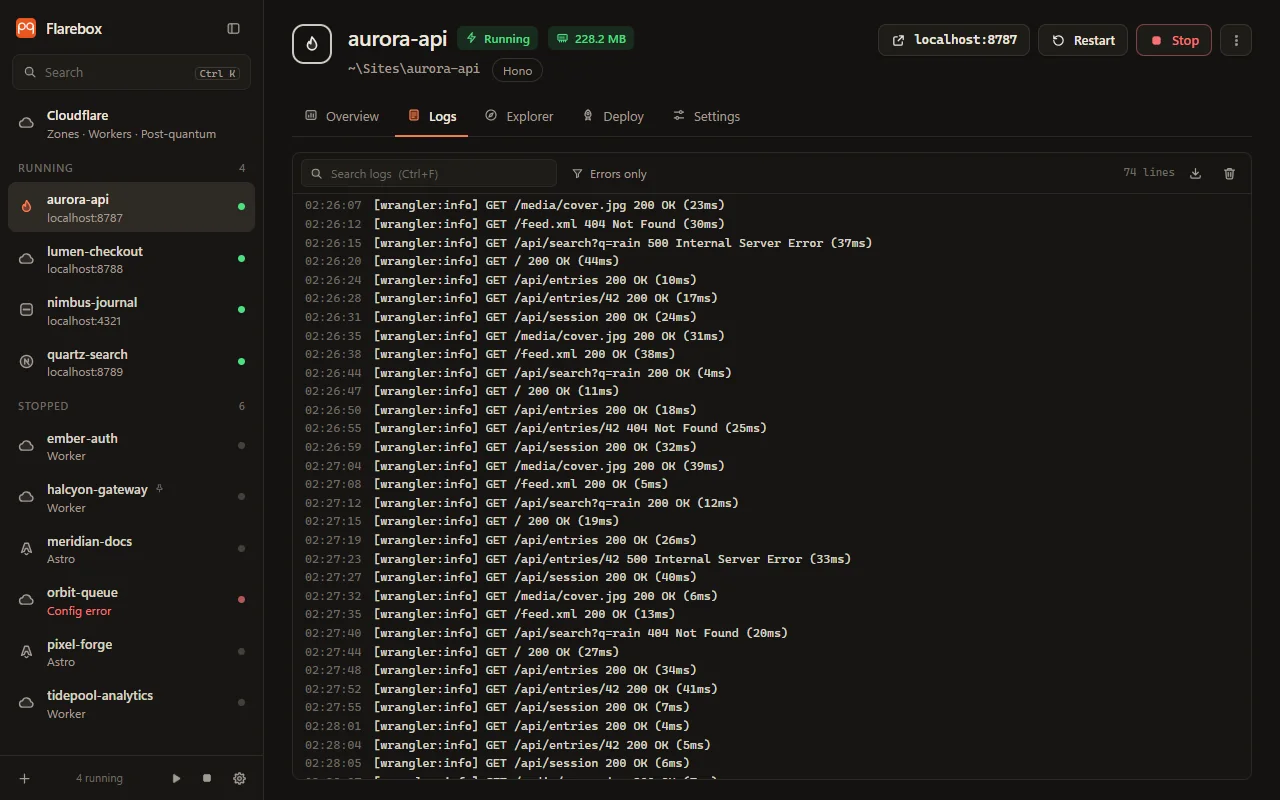
- Search with Ctrl+F.
- Errors only and auto-follow.
- The tab’s badge counts errors.
- Save logs… in the project menu writes them to a file you pick. Flarebox keeps the last 5,000 lines in memory and doesn’t write logs to disk on its own.
Details
Section titled “Details”The Overview’s details list the config file, compatibility date, the wrangler version and how it runs, the routes and custom domains, with copy buttons.